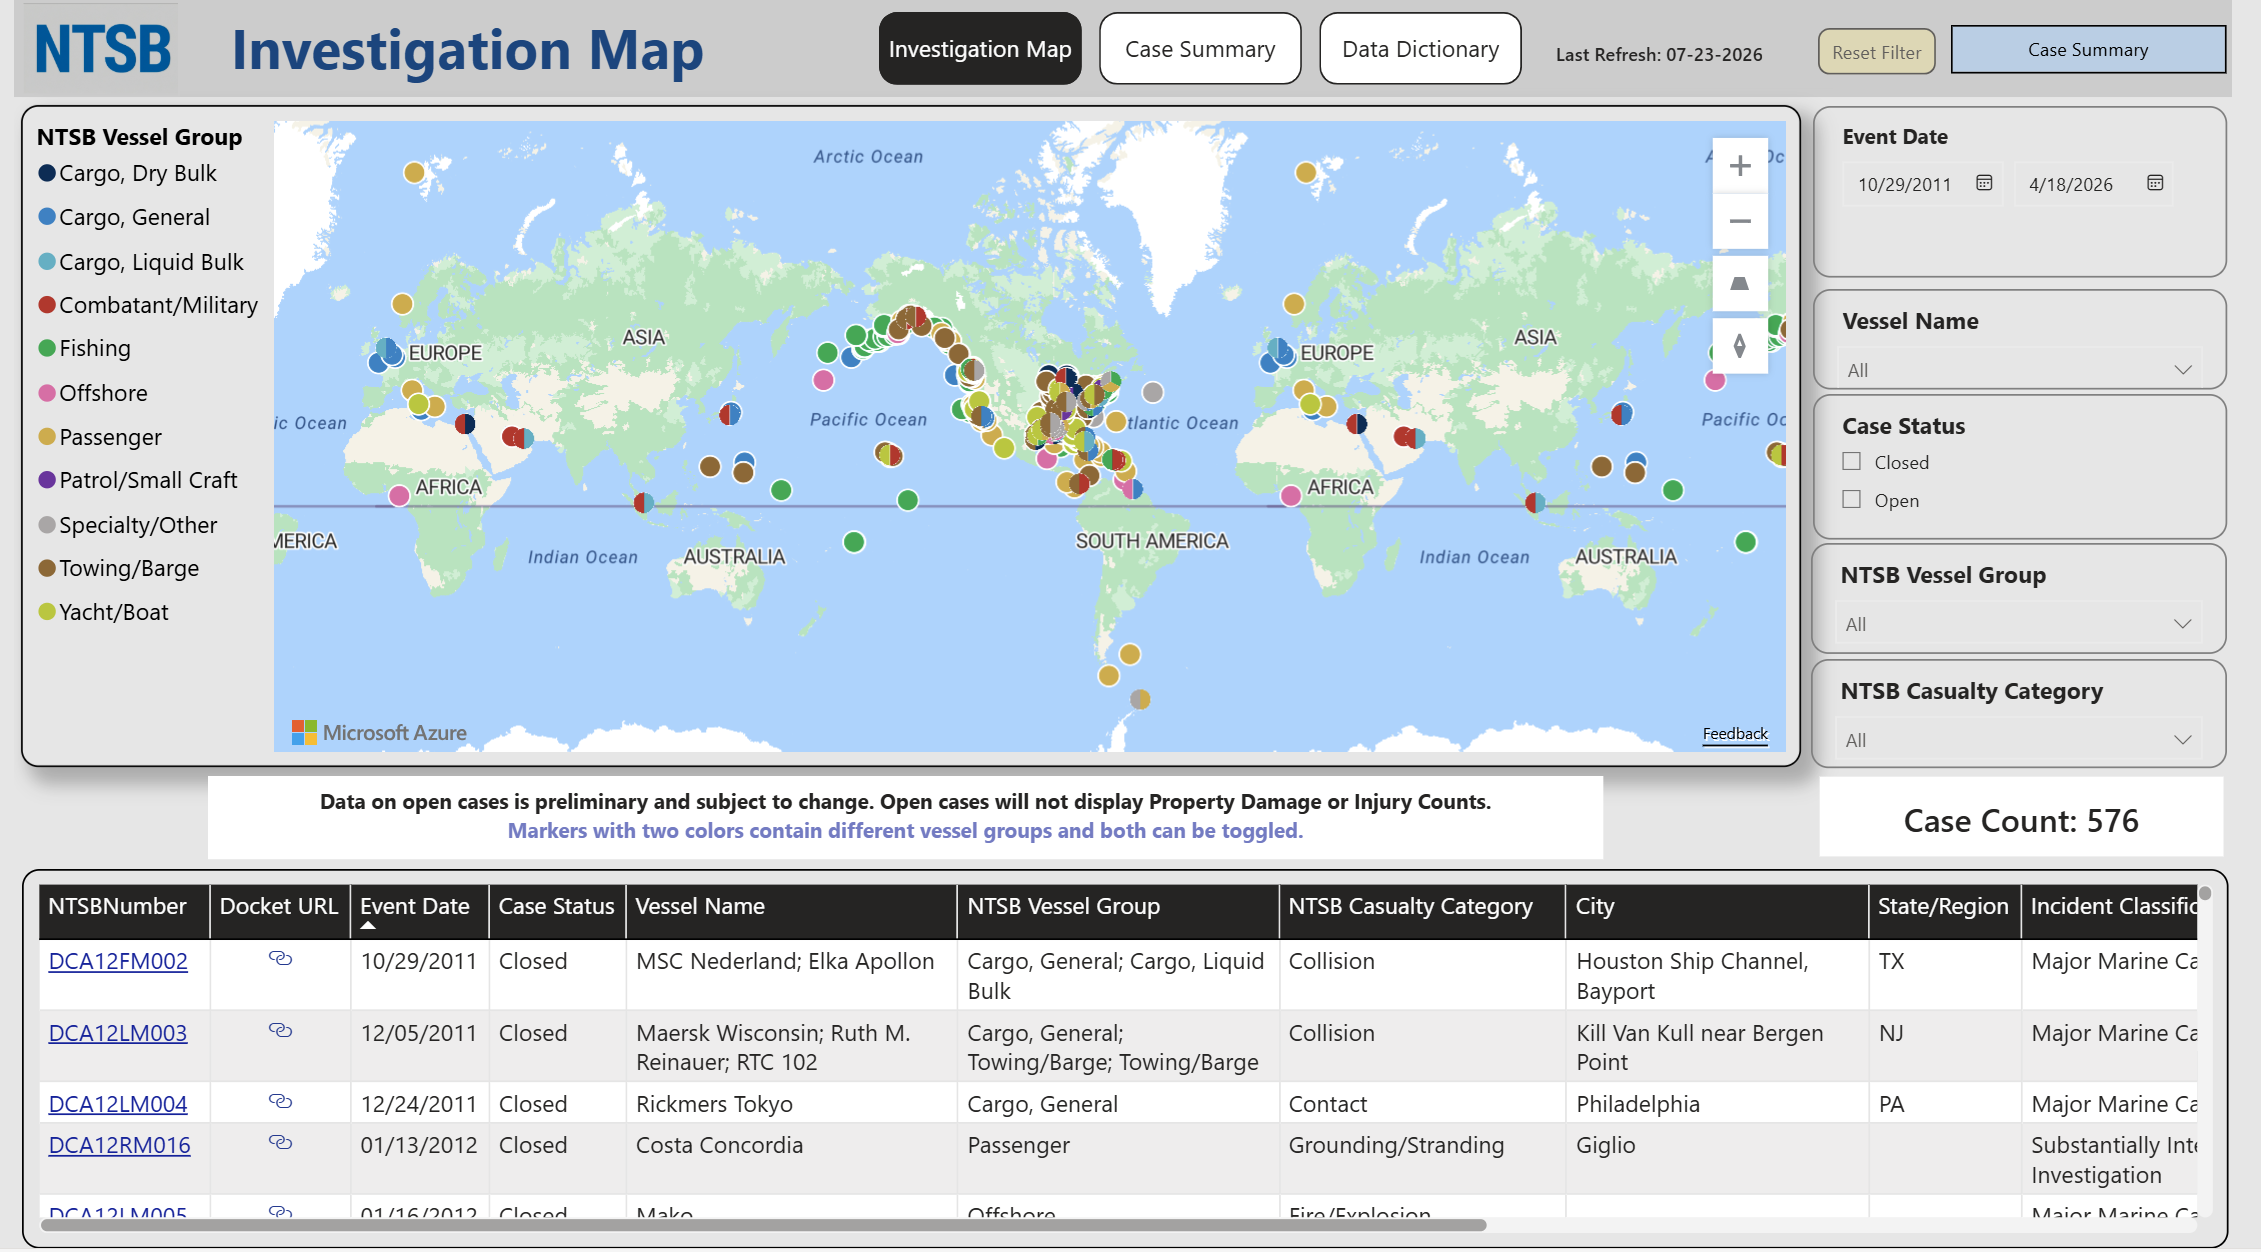
This interactive dashboard summarizes and visualizes NTSB marine investigations occurring from 2012 to the present. Data for investigations occurring before 2012 will be added in future releases.
Users can view data using the Investigation Map and Case Summary dashboard pages. Both dashboard pages are filterable by event date, vessel name(s), case status (open or closed), NTSB vessel group, and NTSB casualty category.
Investigation Map: This dashboard page is an interactive map showing NTSB investigations. The color of each map dot corresponds to the type of vessel(s) involved.
Case Summary: This dashboard page provides statistical graphs showing the number of investigations by NTSB vessel group and NTSB casualty category.
The data table below the map and graphs provides basic casualty information and links to the investigation page and docket for each selected investigation. More detailed information for each investigation can be found on the investigation page and in the docket.