Introduction
Preventing accidents and protecting occupants involved in accidents are the two ways to reduce the incidence of fatalities and serious injuries associated with air travel. The National Transportation Safety Board (NTSB) has made numerous recommendations over the years in both areas and occupant protection is on the NTSB 2019–2020 Most Wanted List.
This is an update to the NTSB safety report
Survivability of Accidents Involving Part 121 US Air Carrier Operations, 1983 Through 2000. The NTSB examines the overall proportion of occupants who survive if they are in an accident involving an aircraft operated under
Title 14
Code of Federal Regulations (CFR) Part 121 (generally defined as large aircraft operated by airlines and cargo carriers), and whether this has changed since the NTSB’s 2001 report. The prevalence of serious injuries in Part 121 aircraft accidents is also assessed.
The NTSB examined air carrier operations performed under Part 121 because most NTSB survival factors investigations are conducted in connection with accidents involving Part 121 operations. Therefore, more survivability data are available for Part 121 operations than are available for other operations, such as Part 135 or Part 91. This update also examines cause-of-death information for the most serious of the Part 121 aircraft accidents.
NTSB’s 2001 Safety Report
The 2001 NTSB safety report showed that between 1983 and 2000, about 95% of Part 121 aircraft occupants involved in accidents survived. The safety report also examined a smaller subset of Part 121 passenger flight accidents that occurred in the United States and included all of the following:
- a precrash or postcrash fire
- at least one serious injury or fatality
- a substantially damaged or destroyed aircraft
Of the occupants involved in that smaller subset of serious accidents, more than half survived.
Methodology
In this update, like its 2001 safety report, the NTSB used data from its
aviation accident database and activity data provided by the Federal Aviation Administration. The analyses examined trends in flight activity, accidents, fatalities, and injuries from 1983 through 2017 for Part 121 air carrier operations. Some comparisons between findings from the NTSB’s 2001 report and the 17‑year period from 2001 through 2017 are also provided. The
full data set used for the analyses in this update is also available; the data is current as of March 23, 2020.
Key Terms
The following key terms are used throughout this update; the definitions are taken from
49 CFR 830.2:
-
Aircraft Accident: An occurrence associated with the operation of an aircraft which takes place between the time any person boards the aircraft with the intention of flight and all such persons have disembarked, and in which any person suffers death, or serious injury, or in which the aircraft receives substantial damage.
-
Substantial Damage: Damage or failure which adversely affects the structural strength, performance, or flight characteristics of the aircraft, and which would normally require major repair or replacement of the affected component. Engine failure or damage limited to an engine if only one engine fails or is damaged, bent fairings or cowling, dented skin, small punctured holes in the skin or fabric, ground damage to rotor or propeller blades, and damage to landing gear, wheels, tires, flaps, engine accessories, brakes, or wingtips are not considered “substantial damage.”
-
Fatal Injury: Any injury which results in death within 30 days of the accident.
-
Serious Injury: Any injury which: (1) Requires hospitalization for more than 48 hours, commencing within 7 days from the date the injury was received; (2) results in a fracture of any bone (except simple fractures of fingers, toes, or nose); (3) causes severe hemorrhages, nerve, muscle, or tendon damage; (4) involves any internal organ; or (5) involves second- or third‑degree burns, or any burns affecting more than 5 percent of the body surface.
Results
Flight Activity
Flight activity is measured in total departures, total flight hours, and total flight miles. As shown in figure 1, total annual Part 121 departures reached a peak in the year 2000. Between 2001 and 2017, there was a 15% decrease in total departures.
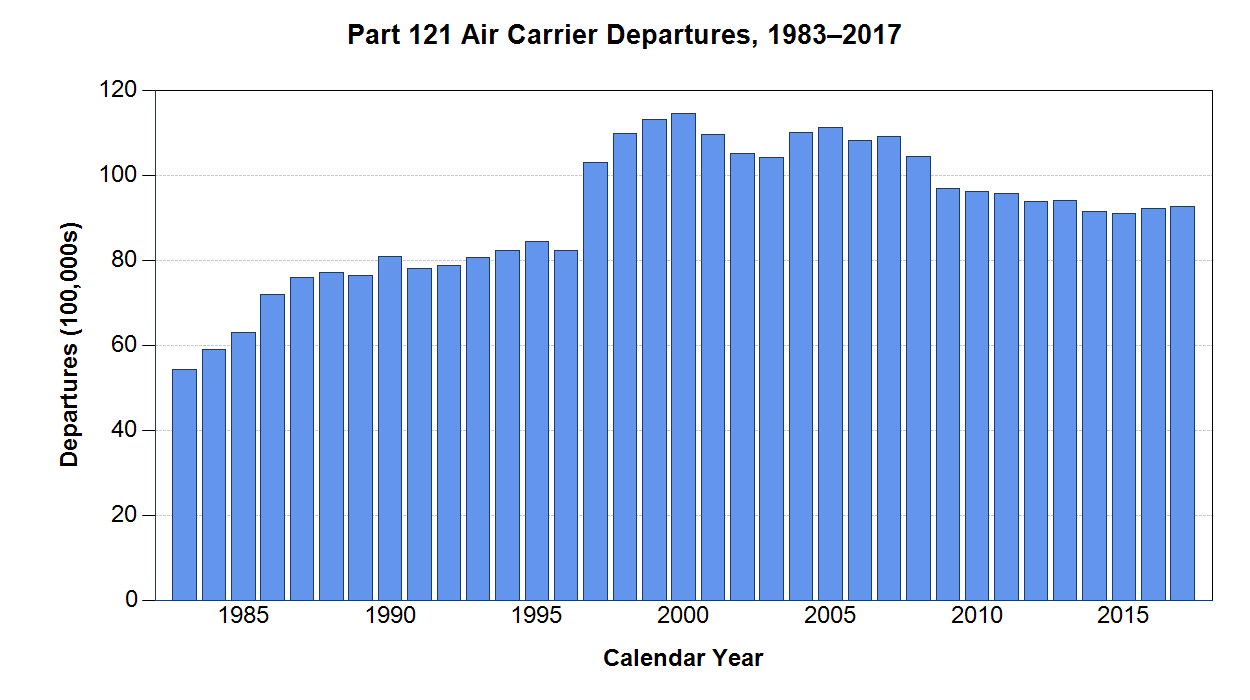 Figure 1. Part 121 air carrier departures, 1983–2017.
Total flight miles and total flight hours, shown in figure 2, increased between 2001 and 2017, rising 12% and 4%, respectively. The differences in the changes between departures and flight miles and hours can be explained by the average trip length, which increased by about 214 miles between 2001 and 2017.
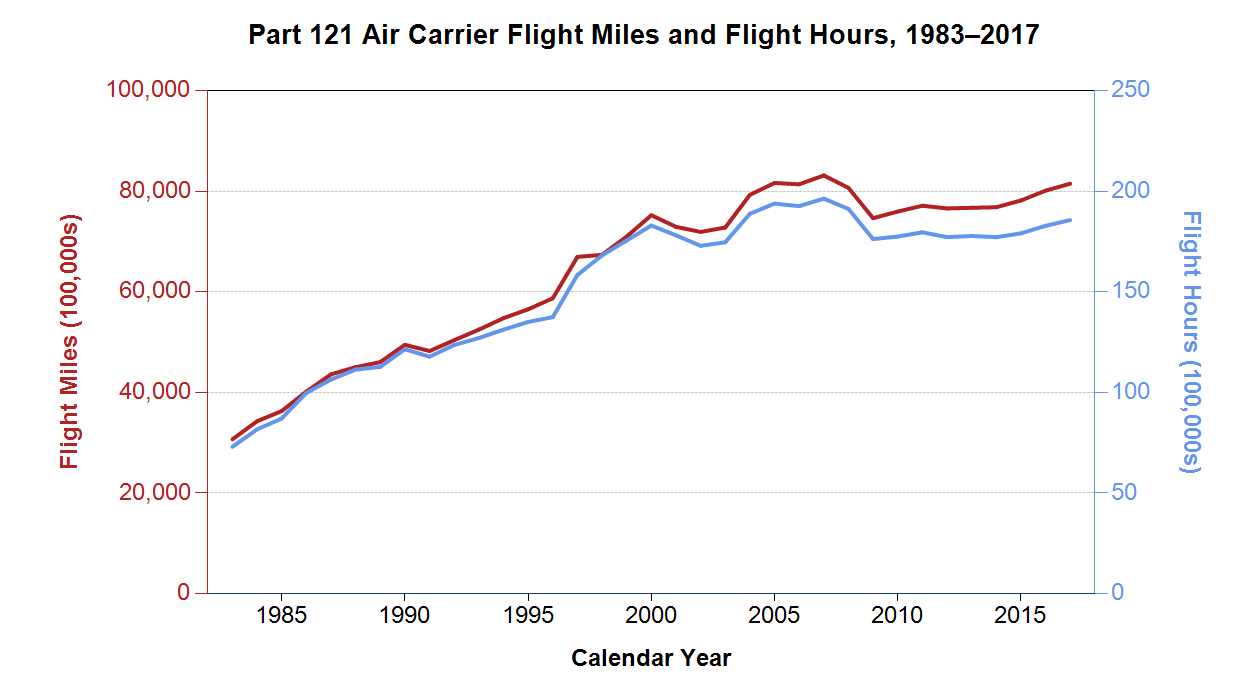 Figure 2. Part 121 air carrier flight miles and flight hours, 1983–2017.
Accidents and Accident Severity
Figure 3 shows the number of accidents per year by the highest injury level for the period 1983 through 2017. The peak accident period occurred in 2000 when there were 56 accidents. Over the past decade, there has been an average of 29 accidents per year. Figure 3 also illustrates that the proportion of accidents involving a fatality, indicated in gray, is small for the entire period and particularly in recent years.
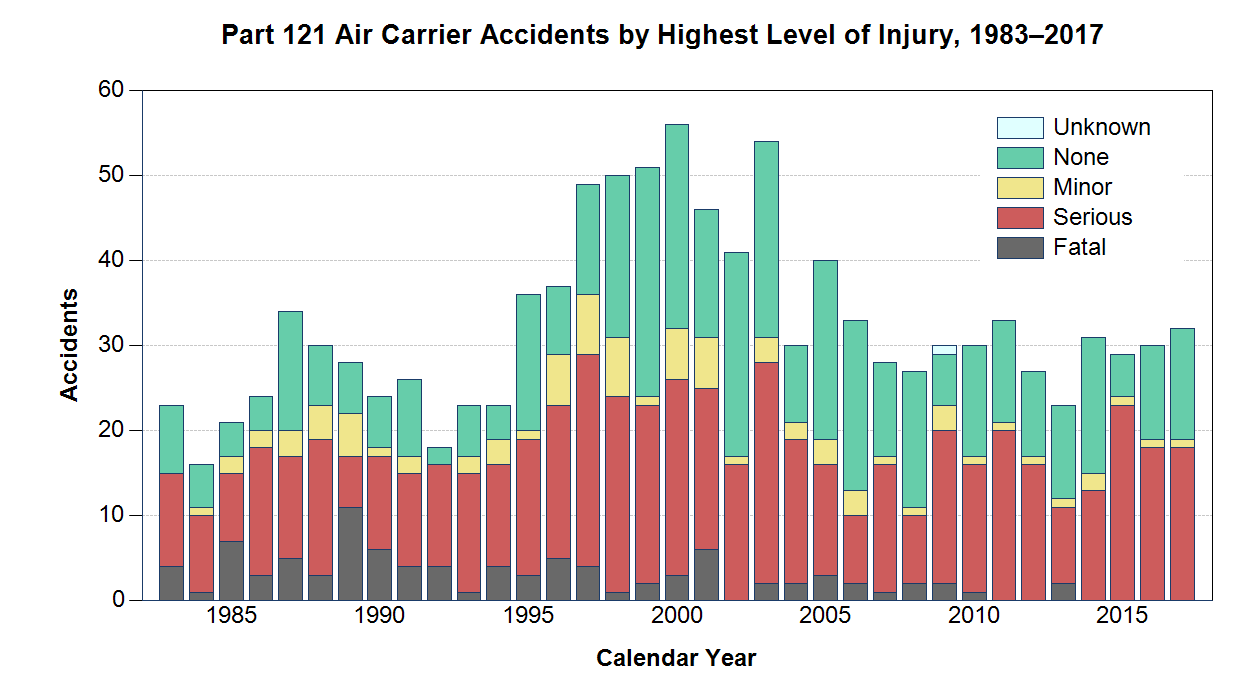 Figure 3. Part 121 air carrier accidents by highest level of injury, 1983–2017.
During the 18-year period from 1983 through 2000, which was described in the 2001 NTSB report, there were 569 accidents involving Part 121 operations. As shown in table 1, 12.5% of those accidents resulted in at least one occupant fatality. By contrast, during the 17-year period from 2001 through 2017, 4.1% of 565 Part 121 accidents resulted in at least one fatality. Table 1 also shows that both the overall accident rate and the fatal accident rate per 100,000 flight hours decreased substantially between the two periods. The fatal accident rate during the period 2001 through 2017—0.006 per 100,000 flight hours—is equivalent to about one fatal Part 121 accident for every 16.3 million flight hours.
Table 1. Part 121 flight activity, accidents, and accident rates (per 100,000 flight hours), 1983–2000 and 2001–2017.
| 1983-2000 | 225,091,664 | 569 | 0.251 | 71 (12.5%) | 0.030 | 263 (46.2%) | 0.117 |
|---|
| 2001-2017 | 310,202,650 | 564 | 0.181 | 23 (4.1%) | 0.006 | 272 (48.2%) | 0.088 |
|---|
Occupant Survivability and Injury Outcomes
Figure 4 shows that, for about 94% of Part 121 aircraft involved in accidents, 100% of the occupants survived. Many of these cases involved turbulence events, resulting in serious injuries to one or more occupants but no fatalities. Other accidents, such as bird strikes or on-ground collisions between taxiing aircraft, may result in substantial damage to aircraft but rarely involve injuries or fatalities among aircraft occupants.
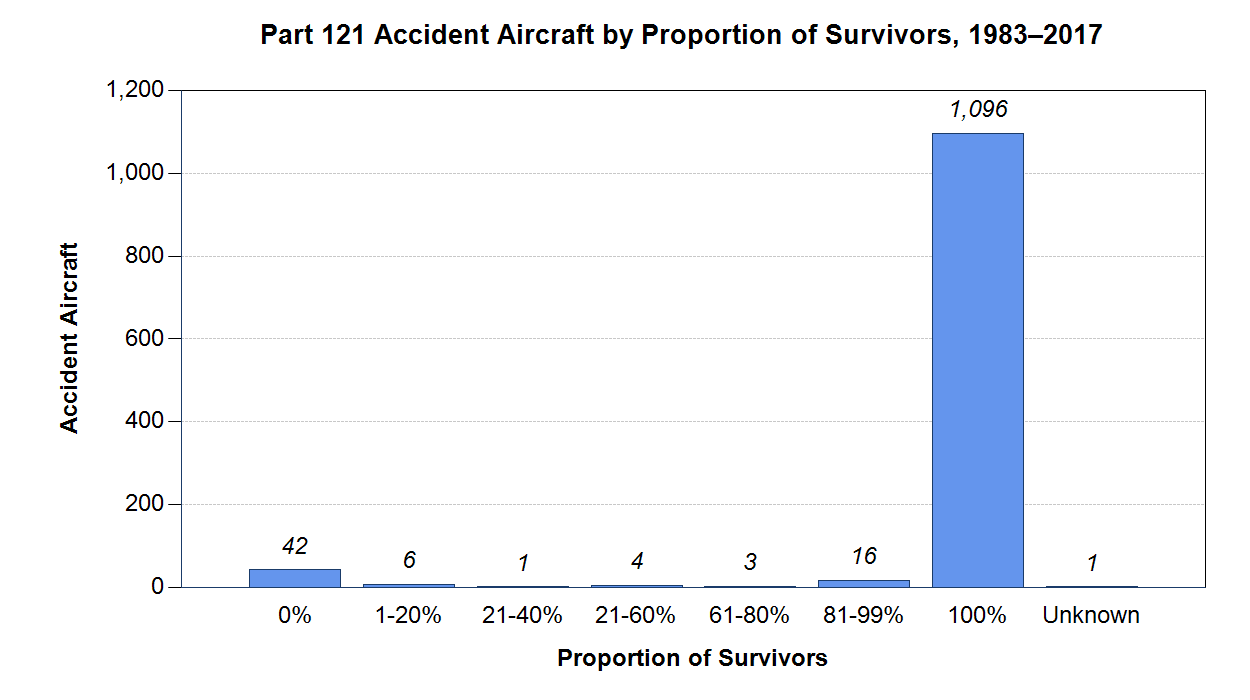 Figure 4. Part 121 accident aircraft by proportion of survivors, 1983–2017.
Table 2 shows the total occupants on board aircraft involved in accidents from 1983 through 2000 and from 2001 through 2017. Although the total number of occupants involved were similar for these two periods, the proportions of fatally and seriously injured occupants varied considerably. For the period from 1983 through 2000, 4.2% of occupants involved in Part 121 aviation accidents were fatally injured as a result of the accident, and 1.1% were seriously injured. For the period from 2001 through 2017, the proportions were 1.3% and 0.6%, respectively.
Table 2. Injury severity for occupants of Part 121 accident aircraft, 1983–2000 and 2001–2017.
| 1983-2000 | 53,953 | 2,280 (4.2%) | 572 (1.1%) | 51,101 (94.7%) |
|---|
| 2001-2017 | 54,748 | 693 (1.3%) | 302 (0.6%) | 53,753 (98.2%) |
|---|
Since the NTSB last reported on this issue in 2001, the Part 121 air carrier accident and fatal accident rates have decreased, and overall survivability and injury outcomes for aircraft occupants involved in accidents have continued to improve.
Occupant Survivability in Serious Accidents
To understand occupant survivability rates in serious accidents, the NTSB focused on a subset of Part 121 passenger flight accidents that occurred in the United States and involved all of the following:
- a precrash or postcrash fire
- at least one serious injury or fatality
- a substantially damaged or destroyed aircraft
Thirty-five accidents that occurred between 1983 and 2017 met these criteria (see
full data set). The NTSB reviewed its accident database, accident reports, and public dockets for information pertinent to occupant injury outcomes and, in the case of fatal injuries, the causes of death in each of these accidents.
Figure 5 shows that among the 35 serious accidents that occurred between 1983 and 2017, all Part 121 aircraft occupants survived in 10 accidents (28.6%), and there were no survivors in 9 accidents (25.7%).
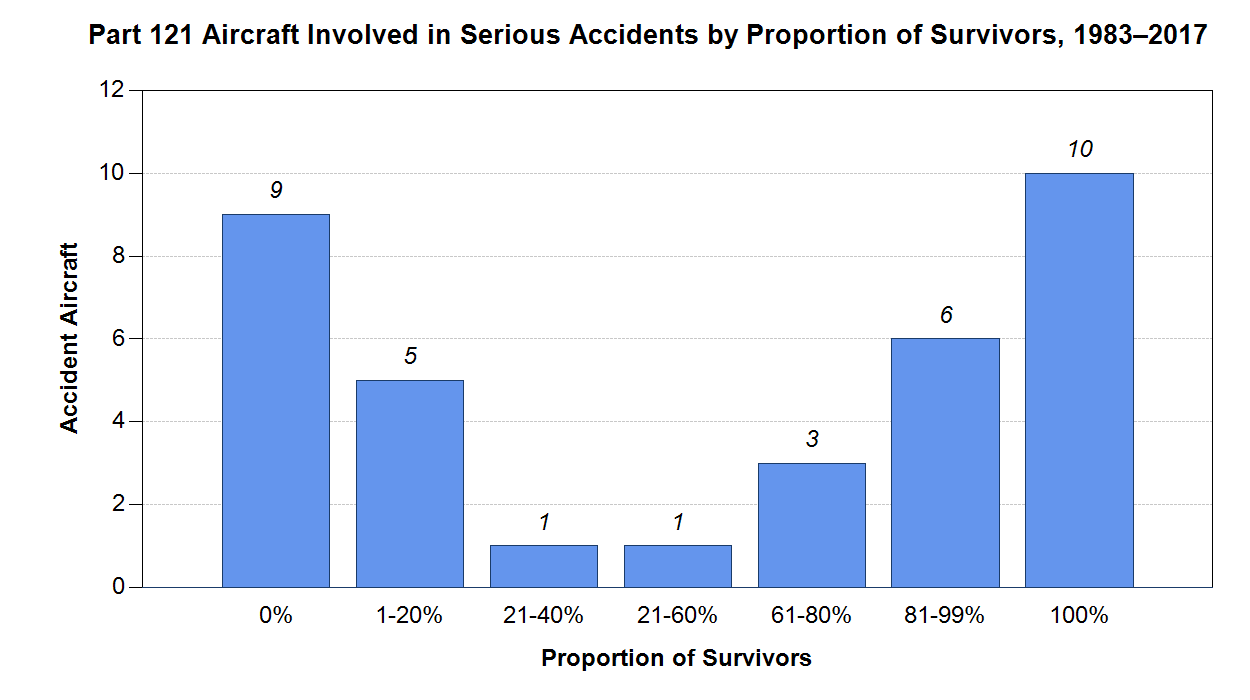 Figure 5. Part 121 aircraft involved in serious accidents by proportion of survivors, 1983–2017.
The 35 serious accidents involved 3,823 total Part 121 aircraft occupants. As shown in figure 6, 52.7% of the occupants survived with minor or no injuries, 6.3% survived but experienced serious injuries, 27.0% died from impact, 9.1% died from unknown causes, 4.1% died from fire or smoke, and 0.7% died from other causes.
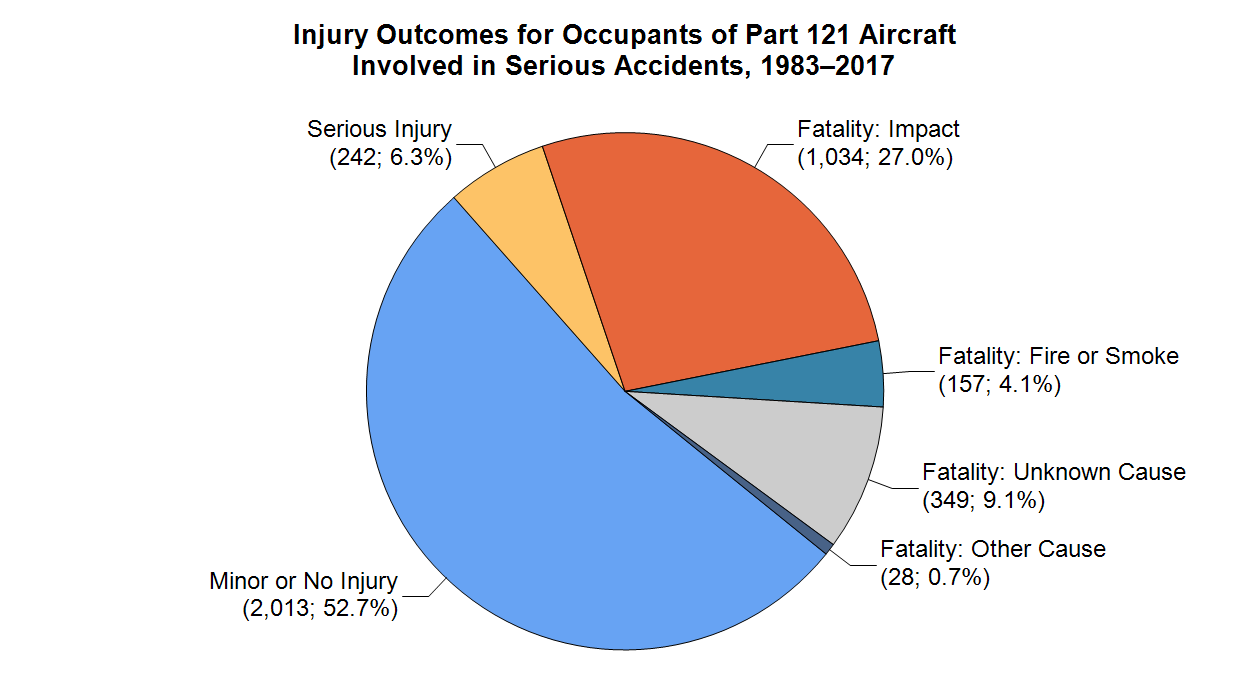 Figure 6. Injury outcomes for occupants of Part 121 aircraft involved in serious accidents, 1983–2017.
Even among serious accidents involving fire, serious or fatal injury, and substantial damage or complete destruction of the aircraft, 59.0% of Part 121 aircraft occupants survived. Among occupants who were fatally injured, impact forces from the accident were the most common cause of death. Among serious accidents that were determined to be survivable (see full data set), 80.8% of occupants survived.

